Solar power production is usually not well understood by the average person as systems are usually sold on the amount of kW of solar panels being installed. But what does that solar power kW rating actually equate to in usable solar power for your system on the Gold Coast? I am glad you asked.
Solar Power Production on the Gold Coast
The kW rating of a system is very important but it is not the only thing that determines the solar power production of a system. The kW rating of a solar power system is at Standard Test Conditions or STC, but what the solar power kW rating actually equates to in solar power production is determined by the location of the solar power system.
Location, Location, Location!
The location of your solar panels is of the utmost importance. As can be seen from the following diagram the path the sun travels through the sky varies throughout the year, on the Gold Coast in the middle of summer the sun rises in the ESE and sets in the WSW with the midday sun nearly directly overhead. In the middle of winter the sun rises in the ENE and sets in the WNW with the midday sun being much lower in the sky, at around 38o from the horizon. The location of solar panels is best in a position where their exposure to direct sunlight is maximised all year round. On the Gold Coast grid connected solar power panels are best located facing within 10o of due North and at a pitch of 25o to 30o. Unfortunately not every rooftop is optimally positioned to these requirements so it is important to understand the losses that occur from a less than optimal installation location.

Solar panel efficiencies on various aspects in SE QLD |
||||||||||
|---|---|---|---|---|---|---|---|---|---|---|
| Panel Aspect | Pitch of the roof / Plane Inclination (in degrees from horizontal) | |||||||||
| 0o | 10o | 20o | 30o | 40o | 50o | 60o | 70o | 80o | 90o | |
| North | 90% | 95% | 99% | 100% | 98% | 94% | 88% | 80% | 70% | 59% |
| North East | 90% | 95% | 96% | 96% | 94% | 91% | 85% | 78% | 70% | 61% |
| East | 90% | 91% | 89% | 87% | 83% | 79% | 74% | 68% | 61% | 55% |
| South East | 90% | 86% | 81% | 75% | 68% | 61% | 55% | 48% | 43% | 38% |
| South | 90% | 85% | 78% | 69% | 59% | 51% | 43% | 36% | 30% | 27% |
| South West | 90% | 86% | 80% | 74% | 66% | 59% | 53% | 47% | 41% | 36% |
| West | 90% | 90% | 88% | 86% | 81% | 76% | 71% | 65% | 59% | 52% |
| North West | 90% | 93% | 94% | 95% | 92% | 88% | 83% | 76% | 68% | 59% |
Please see the following examples of expected solar power production characteristics for solar panels installed at various aspects on the Gold Coast:
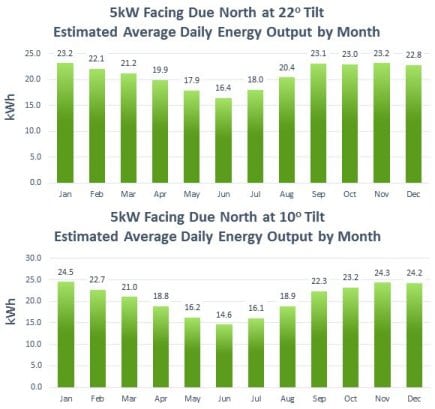
Optimal. Within 10o of due North and at a pitch of 25o to 30o
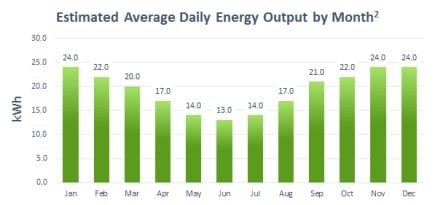
A solar power system installed at this optimal pitch facing due North will maximise the solar power production of your system on the Gold Coast as it will capture as much sunlight as a fixed solar panel can.
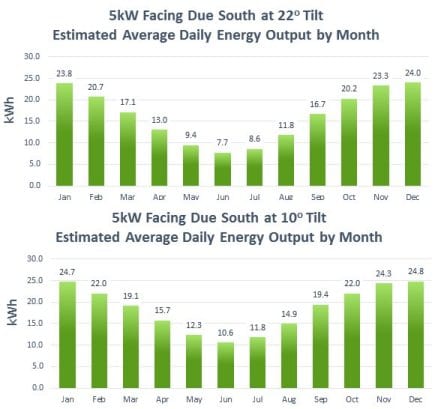
At a lower pitch of 10o the efficiency is lowered slightly to around 95%, however as can be seen in the chart to the right these losses are all over the winter months. In summer when the sun is higher in the sky a solar power system at the lower pitch will actually produce the most power.
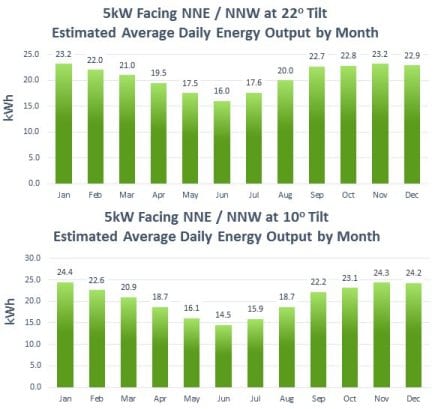
North North East / North North West Solar Power Production
A solar power system installed on the Gold Coast facing NNE or NNW at a pitch of 20o to 40o will work at an efficiency of around 98%. At a lower pitch of 10o the efficiency is exactly the same as solar panels facing due North at a 10o pitch, that is 95%.
Across the Gold Coast and Brisbane a solar power system facing NNE or NNW will perform very well. As per solar panels facing due North a system installed at a 10o tilt will actually outperform a higher tilt system over the months of summer.
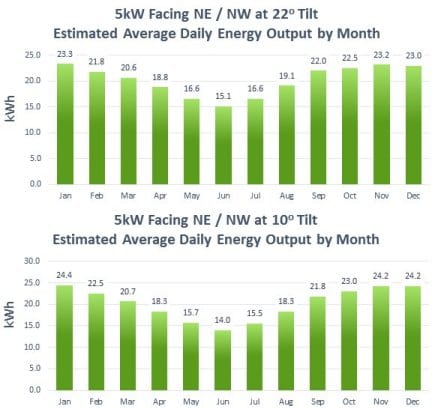
North East / North West Solar Power Production
Solar power panels installed on the Gold Coast facing NE or NW at a pitch between 20o to 30o will be around 96% efficient. At a lower pitch of 10o the efficiency is around 94%.
With larger solar power systems it can work out best to install half the solar panels facing NE and the other half facing NW; this will provide the maximum self consumption of solar power on most properties as the solar peak at midday will be slightly longer.
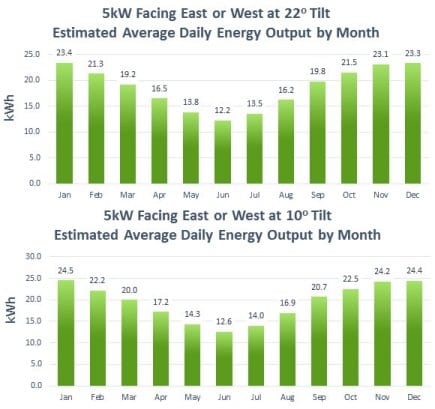
East / West Solar Power Production
Solar power production from panels installed on the Gold Coast facing East or West are quite interesting. At the pitch which is optimal for a solar panel facing due North, that is a pitch between 25o to 30o the panels will be operating at an efficiency of 87% . Solar power systems facing East or West on the Gold Coast at a lower pitch will actually perform better, with an optimal 91% at a pitch of 10o to 20o. A point that is not well known with East or West facing solar power systems on the Gold Coast is that the losses that are encountered are not evenly distributed over the year. In summer an East or West facing system will produce around the same amount of power as a North facing system, the losses are all made up in the rest of the year, chiefly the winter months when the sun does not come anywhere near East or West facing solar panels.
If you had a choice between due East and due West for your solar power system on the Gold Coast I personally would recommend the East aspect as the morning is usually cooler (see article on solar panels and temperature here), this means the solar panels will work more efficiently in the morning. On average the mornings on the Gold Coast are fine with cloud developing in the afternoon, therefore the light falling on the solar panels should be higher in the morning providing a higher solar power production from your system.
Solar Power Production Any South of East / West
Solar power production on the Gold Coast for panels installed South of East or West are not recommended as the losses in winter are quite high. If solar panels are installed facing South a pitch of more than 10o is definitely not recommended. At 10o pitch the efficiency is around 85% and drops down dramatically the greater the pitch.
If you compare the charts of a system facing due North and due South at a tilt of 22o you can see that the system facing South will produce quite a bit less than half the North system in June. South is perfect for solar power in the Northern Hemisphere, but here on the Gold Coast it isn’t good!
Solar Power Production On Flat Roof
Installing solar panels on the Gold Coast flat to a flat or very low pitch roof is not usually recommended as when solar panels are installed flat to a flat or very low pitch roof the self cleaning function of the solar panels doesn’t really work, but in certain situations it is by far the best choice. For more information about installing solar panels on a flat or low pitched roof, go here – Installing solar panels on a flat roof.
So what Solar Power Production Can I expect?
On average throughout the year on the Gold Coast 5.43 kWh of solar radiation can be expected per m2 of North facing, optimum roof space. Now before that 5.43 kWh can be turned into usable power a few losses will need to be taken into account as follows:
- Solar panel nameplate rating: if the manufacturers power tolerance is a -negative reading this will need to be taken into consideration. All solar panels used by Gold Coast Solar Power Solutions have a positive power tolerance, so this is not an issue.
- Inverter losses: As the solar DC power is converted to AC power by the inverter it has some losses, usually between 10-2%. This can usually be found on your inverters data sheet.
- Mismatch between panels: Solar panels very rarely perform exactly the same. The variation between your solar panels will be a loss, somewhere in the range of 3-0.005%.
- Diodes & Connections: Both are necessary with solar panels but are both a potential source of loss, usually in the range of 1-0.003%.
- DC and AC wiring: All cables have some resistance, and resistance is a loss. DC losses are usually between 3-1% and AC between 2-0.007%.
- Soiling: Dirt, bird droppings etc do have a detrimental effect on solar power production. It may be as high a loss as 70%, normally allow around 5%.
- Shading: Shade can be a big issue. Any small amount of shade will have a detrimental effect on power production, we will work on no shade.
- Age: As solar panels age the power production lowers.
As can be seen from the list above many factors need to be taken into account in regards to losses. A standard figure for all these losses other than age and shading would be around 20% loss. That is 1.086 kWh loss from the 5.43 kWh mentioned above, giving a figure of 4.34 kWh. This figure is the expected solar power production from a 1 kW system installed on the optimum North aspect at a pitch between 25o to 30o.
With knowing this optimum solar power production yield of 4.34 kW per kilowatt of solar panels installed you can then start adding other losses due to the orientation of the panels to the equation. For example what average kWh can you expect from a 5 kW solar power system installed facing due West at a pitch of 25o?
Take the optimum output of 4.34 kWh per kW and multiply it by 5 kW, giving 21.7 kWh.
We know from the above E/W section that at this pitch we can expect an efficiency of 87%, that is a loss of 13%.
13% of 21.7 kWh is 2.82 kWh, therefore:
A 5 kW solar power system facing due West at a pitch of 25o can be expected to produce an average of 18.88 kWh per day. As mentioned above these losses will be most pronounced over the winter months.
Learn more about solar panels with the following articles:
- Solar Panel Efficiency
- Mono Crystalline or Poly / Multi Crystalline – Does it Matter?
- The Differences Between Solar Panels
- Solar Panels and Temperature